Financial analysis never sleeps, which is why the Calcbench research team was picking through corporate filings that arrived on the otherwise quiet, post-holiday day of July 5 — and we came across the latest quarterly filing for KB Home ($KBH), one of the largest homebuilders in the country.
We fired up our Disclosures & Footnotes tool, and randomly decided to look at KB Home’s debt disclosure. Hoo boy, that perked us right up!
Figure 1, below, shows what we found. KB has four notes payable, each for several hundred million dollars, coming due within the next several years. Moreover, those notes have interest rates anywhere from a rather reasonable 4 percent to 7.25 percent, almost high enough to cause a nosebleed.
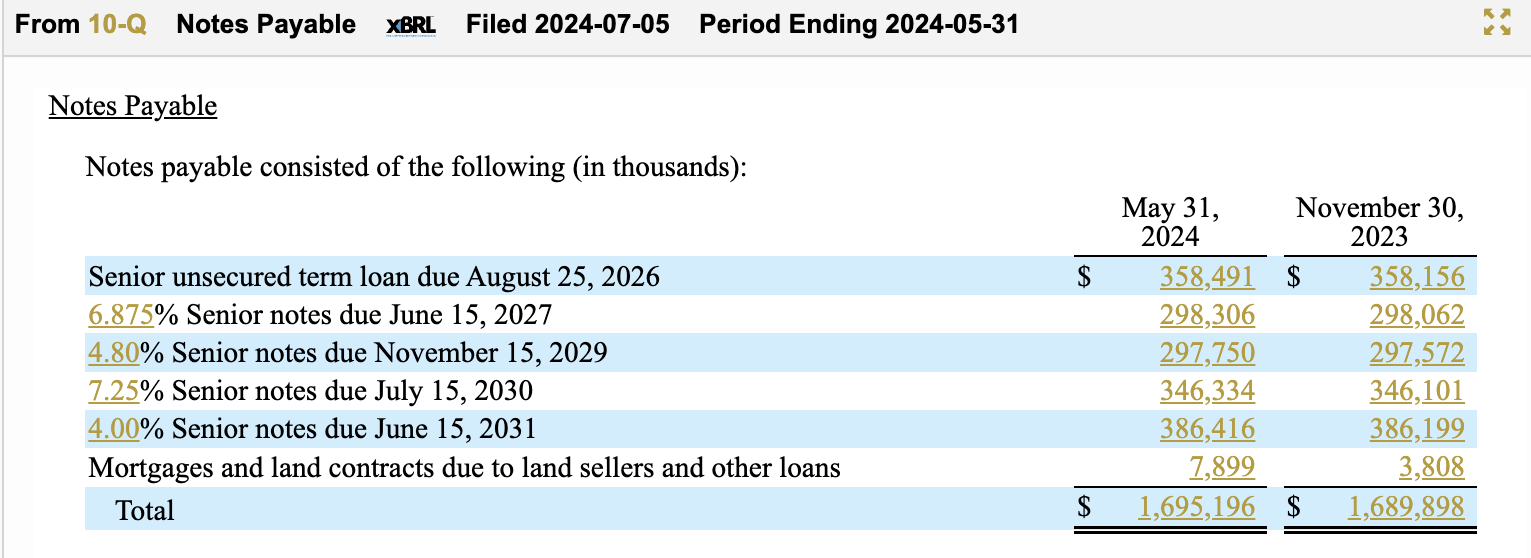
That alone made us wonder about KB Home’s ability to pay off those debts. Then we kept reading through the footnote, and came to this line at the bottom:
As of May 31, 2024, principal payments on our notes payable are due during each year ending November 30 as follows: 2024 – $4.3 million; 2025 – $1.0 million; 2026 – $360.6 million; 2027 – $300.8 million; 2028 – $.8 million and thereafter – $1.04 billion.
Yikes, that’s a lotta debt coming due in two years’ time. Perhaps that will work in KB’s favor; maybe the Fed will be in a rate-cutting cycle by then, and the company can refinance the debt at rates lower than what we see today. On the other hand, if that calculation turns out wrong and rates aren’t substantially lower, KB could be in for either (a) continued high debt loads and interest payments, if it refinances at high rates anyway; or (b) some painful financial reckoning as the company pays down its debt.
Well, what about paying off that debt — is KB throwing off enough cash to do that? To ponder that question, we flipped over to our Company-in-Detail database to look at KB’s balance sheet and statement of cash flows for the last few years.
The short answer is that we’re not financial analysts, so we aren’t making any predictions. But we can show you some of KB’s relevant disclosures, to let you draw your own conclusions.
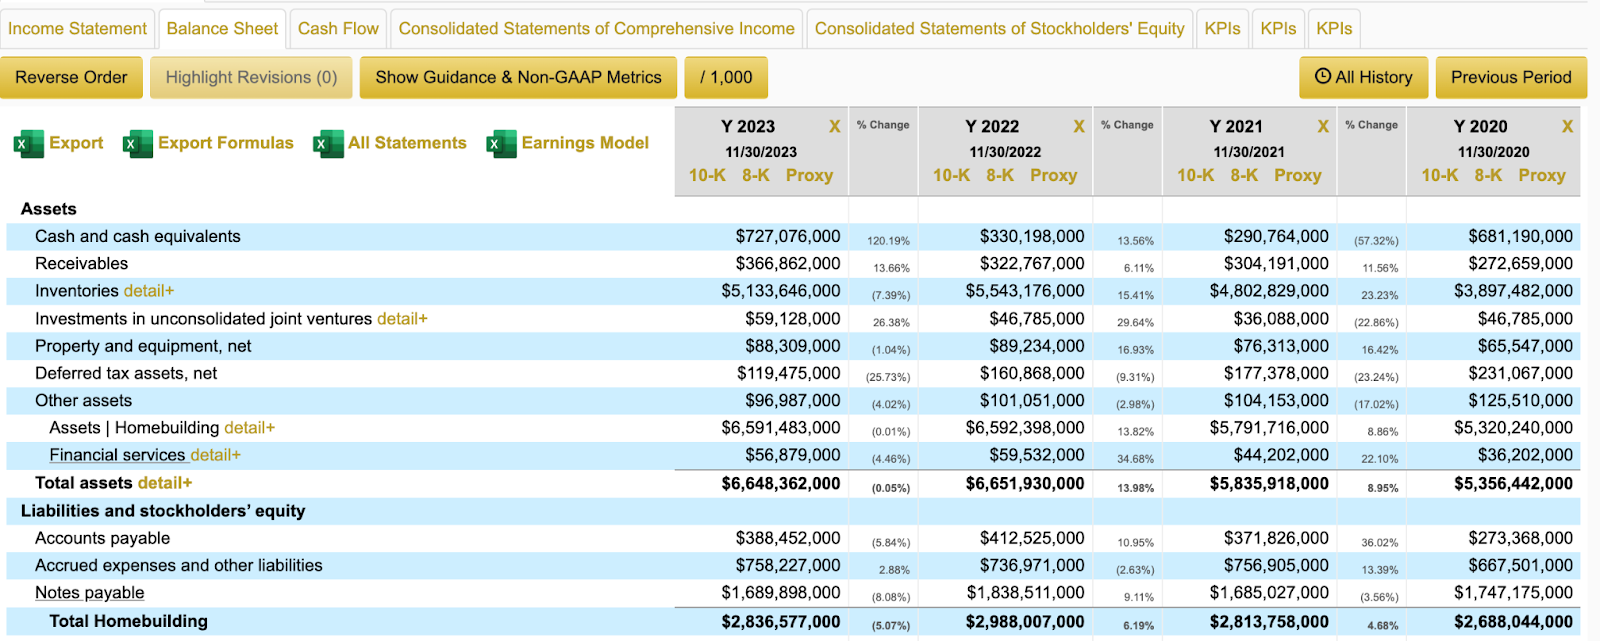
For example, Figure 2, below, shows KB Homes’ balance sheet for the last few years. Cash has zig-zagged up and down over the last four years, most recently landing at $727.1 million for the fiscal year that ended last November. At the same time, notes payable has fluctuated in a much narrower range, landing at $1.69 billion in the last fiscal year.
Next we have the statement of cash flows. That shows a surge in cash from operating activities in the most recent fiscal year to $1.08 billion, although that surge largely comes from a huge positive swing in inventories plus other assorted accounting moves, such as an increase in deferred taxes. See Figure 3, below.
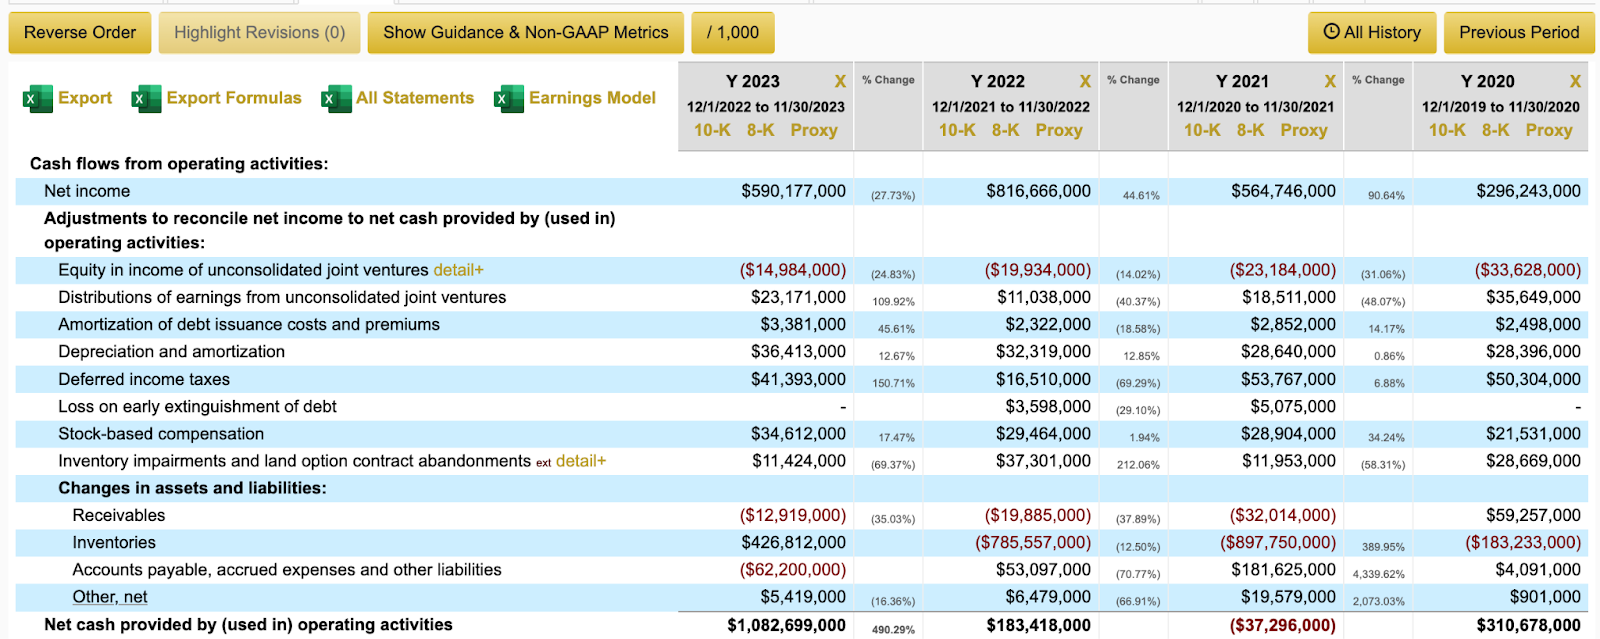
On the other hand (and not shown here), KB Homes saw a decline in cash generated from investing and financing activities; although it did end 2023 with an increase in cash of $397.1 million.
All this is to say that good financial analysis requires careful examination of both the primary financial statements and the footnote disclosures; you can’t understand the whole story — including, critically, where the business is likely to go in the future — by looking at only one set of disclosures. You need both.
Which, coincidentally, Calcbench has.